
The above mural was painted by Renaldo Hernandez in 1993, located at 611 W. National Ave., Milwaukee, WI
**The Following Graphics are Based on the 2010 U.S. Census, Unless Otherwise Noted
Population of Wisconsin by Race and Ethnicity
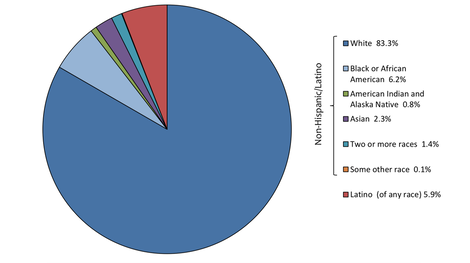
Image by UW-Madison's Applied Population Laboratory in "Latinos in Wisconsin- A Statistical Overview"
|
This graph shows the breakdown of the population of Wisconsin. Latinos make up about 6% of the population of Wisconsin, following Non-Hispanic whites which make up 83% of the population, and just behind African-Americans, who make up just over 6% of the population Although, "Latino" is not any one particular race, the Latinx community is often grouped together. The following graph will break down the backgrounds of the "Latino" categorization. [1]
|
Heritage of Latinos
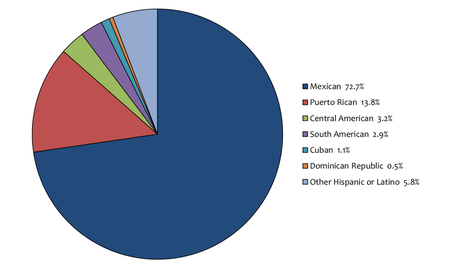
Image by UW-Madison's Applied Population Laboratory in "Latinos in Wisconsin- A Statistical Overview"
|
This graph further expands on the "Latino" categorization of the Wisconsin population referenced throughout this website. Specifically, note the high percentage comprised of Mexicans. [2] This is partly due to the Bracero Program, which allowed farmers to hire migrant workers, from 1942-1964. Although "Braceros" came from multiple Latinx countries, a majority came from Mexico. [3]
|
Latino Population in Wisconsin Counties
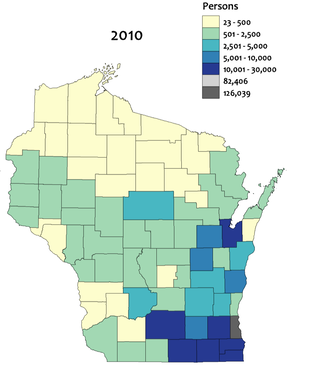
Image by UW-Madison's Applied Population Laboratory in "Latinos in Wisconsin- A Statistical Overview"
|
This graphic demonstrates the Latino population in specific Wisconsin Counties. By far, Milwaukee County is home to the most Latinos, in which 37% of Wisconsin's Latino population reside. The next three counties with the largest Latino population are Dane, Racine, and Kenosha Counties, in which 22% of the Latino population of Wisconsin reside, collectively. In 2000, Milwaukee County was the only county in which more than 15,000 Latinos resided. However, by 2010, Milwaukee Dane, Racine, Kenosha, Brown, and Waukesha Counties all had Latino populations higher than 15,000. [4]
|
Latino Population in Wisconsin
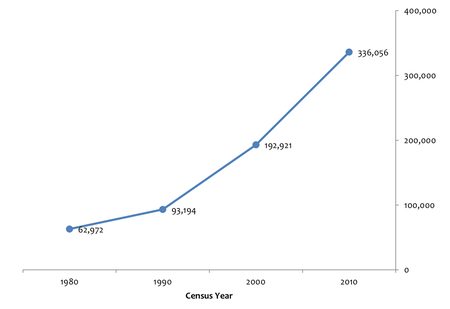
Image by UW-Madison's Applied Population Laboratory in "Latinos in Wisconsin- A Statistical Overview"
|
This graph shows the increase in Latino population from 1980-2010. The highest overall growth rate occurred from 2000-2010 during which a 74% growth rate was observed. However, this graph does not clearly indicate year by year growth rate. For example, during the 2007 recession in the United States, significantly less people migrated from Mexico to the United States. Adversely, in 1994 during the Mexican economic crash, more people migrated from Mexico to the U.S. [5]
|
Rural and Urban Population in Wisconsin
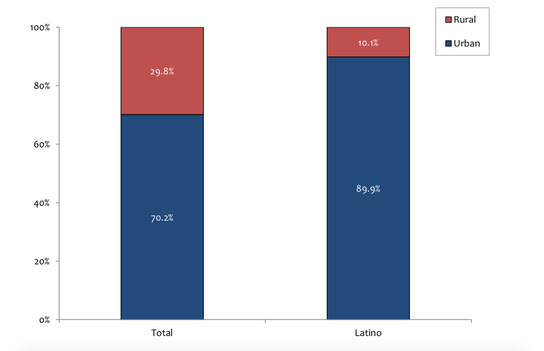
Image by UW-Madison's Applied Population Laboratory in "Latinos in Wisconsin- A Statistical Overview"
|
This graph shows that just about 10% of Latinos in Wisconsin live in rural areas, as opposed to about 30% of Wisconsin's total population. [6] Interestingly, most Latinos who originally moved to Wisconsin moved for agricultural work in rural areas. The shift from rural to urban communities is primarily due to the termination of the Bracero Program in 1964 with which farmers stopped hiring primarily migrant workers and latinos moved to Milwaukee and other urban areas. [7]
|
[1] Long, David, and Dan Veroff. “Latinos in Wisconsin - A Statistical Overview.” Rep. Latinos in Wisconsin - A Statistical Overview. Madison, WI: UW Applied Population Laboratory & University of Wisconsin Extension, 2014.
[2] Ibid.
[3]“20th-Century Immigration.” Wisconsin Historical Society , 2019.
[4]Long, David, and Dan Veroff. “Latinos in Wisconsin - A Statistical Overview.” Rep. Latinos in Wisconsin - A Statistical Overview. Madison, WI: UW Applied Population Laboratory & University of Wisconsin Extension, 2014.
[5] Ibid.
[6] Ibid.
[7]“Hispanic/Latinos in Wisconsin: History.” Wisconsin Department of Health Services, September 10, 2018.
